
An all-but-inevitable byproduct of living in an industrialized, technologically advanced society is that most people eat a diet that consists mainly of processed foods or foods grown by massive agriculture conglomerates. While mass-processing food has benefits like increased efficiency and convenience, there are also many important drawbacks.
Agrichemical Residue
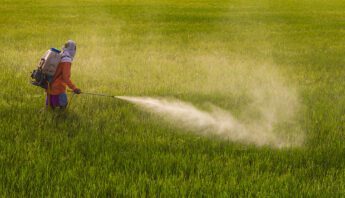
 We have been sounding the alarm on exposure to pesticide residue for forty years, so this should come as no surprise. Pesticide regulations in the U.S. are well behind much of the rest of the industrialized world. This is mostly because agrichemical corporations like Monsanto and Bayer have too much influence in Washington, but also because pesticide regulation in the U.S. does not adequately account for things like additive and synergistic effects.
Since the Environmental Protection Agency (EPA) regulates most chemicals on a chemical-by-chemical basis, the combined and cumulative effects of a mixture of pesticides are nearly impossible for them to address—and so they usually don’t.
Given these complexities, the smart solution would be to follow the European Union’s lead and adopt the “precautionary principle” as the basis for regulatory decision-making. Put simply, this approach prioritizes protecting human health when there is significant doubt about the safety of a product. Rather, pesticides and industrial chemicals in the U.S. are innocent until proven guilty. And it often takes decades to prove a chemical guilty.
Meanwhile, we are exposed to dozens of pesticides in the food we eat, water we drink and air we breathe.
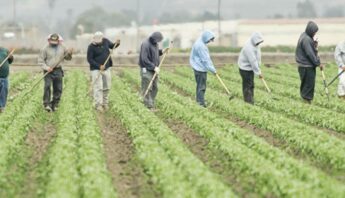
 Farmers and farmworkers are some of the hardest working people on the planet. Yet they and their families bear the highest health costs and face the greatest risks of pesticide exposure. Poisoning incidents among farmworkers are vastly underreported – yet in California alone, hundreds of cases of pesticide poisoning are documented every year. Farmworkers in particular remain the least protected class of workers in the U.S.
But farmers and farmworkers aren’t alone in their plight; pesticides find their way onto and into the food all of us eat, and unfortunately most of us are born with persistent pesticides and other chemicals already in our bodies, passed from mother to child during fetal development. The human health impacts linked to pesticide exposure range from birth defects and childhood brain cancer in the very young, to Parkinson’s Disease in the elderly. In between are a variety of other cancers, developmental and neurological disorders, reproductive and hormonal system disruptions, and more.
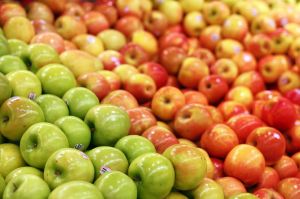
Does eating organic make a difference? When researchers compared the levels of pesticide breakdown products in the bodies of children who eat organic and conventional diets, they found children who eat mostly organic foods carry fewer pesticides in their bodies. The good news is that some of these pesticides break down fairly quickly, which means increasing your consumption of organic foods can have an immediate impact on your pesticide exposure levels.
Climate Impacts of an Industrialized Food System
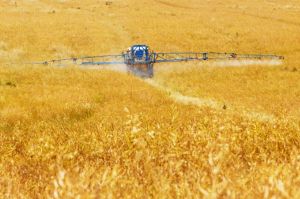 Further complicating this issue is the fact that pesticides don’t stay where they’re applied. They drift from their target and are carried in our air, oceans, rivers, groundwater and soil. They contaminate ecosystems, can contribute to biodiversity collapse, and can poison fish, birds and wildlife. Water supplies around the world contain measurable amounts of pesticides, including atrazine. Atrazine, a suspected endocrine disruptor recently banned in Europe, is the most commonly used herbicide in the U.S.
Besides heavy use in industrial farming, pesticides are used in or near playing fields, parks, schools, public gardens, golf courses, grocery stores, offices, apartment buildings, hotels and resorts, airplanes, cruise ships—the list goes on. Rural communities are routinely contaminated by pesticide drift, while city dwellers may trace pesticide residues on their shoes to public parks and even their apartment’s common areas.
Pesticides are not only directly impacting our health through the food we eat and the air we breathe, but they are also contributing to climate change which is making our planet more vulnerable and is ultimately one of the greatest challenges facing humanity today. In our report on this matter, Pesticides and Climate Change: A Vicious Cycle, we lay out the evidence which indicates that pesticides contribute significantly to greenhouse gas emissions while also making our agricultural systems more vulnerable to the effects of climate change.
All-But-Inevitable? So, there’s hope?
The hyper-industrialized, mass-producing, centralized food system that the U.S. relies on for most of its food is new—like, really new. Prior to the 1950’s, massive monoculture operations and concentrated animal feeding operations (CAFOs) did not exist as they do now in the U.S. They are a direct result of the United States Department of Agriculture’s (USDA) policy shifts toward subsidizing commodity crops and prioritizing quantity over quality.
Farming in the U.S. has become a go big or go home industry where a small number of powerful companies own almost 80% of items bought regularly by Americans in grocery stores. This is according to a 2021 report from Food and Water Watch and the Guardian. But it goes deeper than that, because thanks to the extremely tight profit margins of the agriculture and food industries, these companies are closely intertwined with and reliant upon pesticide manufacturers. This interconnectedness creates inherent vulnerabilities in our food system, as we saw during the pandemic when slaughterhouse backups and staffing shortages at meatpacking plants resulted in inflation and empty shelves.
A Future Grounded in Agroecology
 If policy shifts created this problem, policy shifts can solve it, too. Agroecology is a productive, ecologically resilient, equitable, and economically viable approach to farming that integrates cutting edge science with local and Indigenous knowledge and practice, and a commitment to the political approach of food sovereignty.
Agroecology includes organic farming, intercropping, prioritizing soil health and biodiversity, crop rotation; it also encompasses seed sovereignty, food as a human right, and worker justice. PAN supports agroecology as a viable alternative for chemical-intensive farming and advocates for policies and legislation that would encourage the agriculture industry to embrace it.
For Consumers
 So, how can consumers manage their exposure to pesticides in the meantime? By eating food produced organically or without pesticides, not only will you be reducing the amount of pesticide in your body, you will be helping create a better environment for other people, the planet, and future generations.
It’s sometimes difficult to access organic produce. Health-conscious shoppers can still avoid pesticides by using resources such as the Environmental Working Group’s Shopper’s Guide to Pesticides in Produce which is an annual publication that lists the most and least contaminated fruits and vegetables according to data from the Department of Agriculture and Food and Drug Administration.
We also invite you to take part in our Action Center where we often have active calls for action around pesticide regulation. By engaging in political action to change our food system, you’ll be part of making sure that everyone can eat their meals without pesticides on the side.
Honoring the Legacy of WhatsOnMyFood
In 2009, PAN set out to educate consumers about what pesticides might be hiding on their produce. It was a very large project, and it resulted in a searchable database that was used by tens of thousands of consumers and researchers over the years.
Though this resource was valuable and we are proud of our work, in 2024 we ended this project so that we could turn our focus toward more advocacy for agroecology and better pesticide regulation. Those seeking similar information are encouraged to use the database produced by the Pesticide Data Program which was the dataset historically used by WhatsOnMyFood, or the Dietary Risk Index tools provided by Hygeia Analytics.